

LAZ
-
Posts
148 -
Joined
-
Last visited
-
Days Won
6
Posts posted by LAZ
-
-
The year was 1986. It was homecoming for UCF and a record crowd of over 23,000 came to the Citrus Bowl anticipating a beat down of then NAIA member Wofford (SC) and The Beach Boys concert which would immediately follow the game. Apparently, the Terriers had other intentions. Their vaunted single wing offense was like nothing I’d ever seen and it was soon obvious the UCF defense hadn’t either. It was probably the most embarrassing moment in Knights history. They lost that homecoming game to a school nobody ever heard of 31-28 putting quite a damper on the whole evening. As for the concert, I barely remember it.
-
Joshua,
Got it! Thanks a lot!!
-
Can someone please explain the logistics here? Isn't Bell Creek playing 8-man football?
Thanks.
-
Young Kids in Motion Academy (In Jacksonville).
Fri, 10/2
6:00 PM
Jordan Christian Prep
Auburndale, FL
Away • Non-Conference
Fri, 10/23
7:00 PM
Lighthouse Private Christian Academy
Pensacola, FL
Away • Conference
Fri, 10/30
6:00 PM
American Collegiate Academy
Clearwater, FL
Away • Non-Conference
Preview -
For reasons described my previous post, I've split up the country by Division and Regions. As previously stated, conference affiliations are not considered and Rankings are from the period 2015 thru 2019. Here are States in each Region by Division.
P5 North California Colorado Illinois Indiana Iowa Kansas Maryland Mass Michigan Minnesota Missouri Nebraska New Jersey New York Ohio Oregon Pennsylvania Utah Washington West Virginia Wisconsin P5 South Alabama Arizona Arkansas Florida Georgia Kentucky Louisiana Mississippi North Carolina Oklahoma South Carolina Tennessee Texas Virginia G5 North California Colorado Connecticut Hawaii Idaho Illinois Indiana Maryland Massachusetts Michigan Nevada New York Ohio Pennsylvania Utah West Virginia Wyoming G5 South Alabama Arkansas Florida Georgia Kentucky Louisiana Mississippi New Mexico North Carolina Oklahoma South Carolina Tennessee Texas Virginia FCS North California Colorado Connecticut Delaware District of Columbia Idaho Illinois Indiana Iowa Maine Maryland Massachusetts Missouri Montana New Hampshire New Jersey New York North Dakota Ohio Oregon Pennsylvania Rhode Island South Dakota Utah Washington FCS South Alabama Arizona Arkansas Florida Georgia Kentucky Louisiana Mississippi North Carolina South Carolina Tennessee Texas Virginia D2 East Alabama Connecticut Florida Georgia Illinois Indiana Kentucky Maryland Massachusetts Michigan Mississippi New Hampshire New York North Carolina Ohio Pennsylvania South Carolina Tennessee Virginia West Virginia D2 West Arkansas California Colorado Iowa Kansas Minnesota Missouri Nebraska New Mexico North Dakota Oklahoma Oregon South Dakota Texas Utah Washington D3 East Connecticut Delaware District of Columbia Georgia Maine Maryland Massachusetts Michigan New Hampshire New Jersey New York North Carolina Ohio Pennsylvania Rhode Island Vermont Virginia West Virginia D3 West Alabama Arkansas California Illinois Indiana Iowa Kentucky Louisiana Minnesota Mississippi Missouri Nebraska Oregon Tennessee Texas Washington Wisconsin NAIA East Alabama Arkansas Florida Georgia Illinois Indiana Kentucky Michigan Missouri North Carolina Ohio Oklahoma South Carolina Tennessee Texas Virginia NAIA West Arizona Idaho Iowa Kansas Montana Nebraska North Dakota Oregon South Dakota RANKINGS P5
#TEAMS REGION Avg Rank Avg Pwr Top 10% Avg Rnk Top 10% Avg Pwr Bottom 10% Avg Rnk Bottom 10% Avg Pwr 32 South 41.6 117.80 4.3 132.55 75.4 109.29 33 North 47.0 116.27 9.0 128.97 112.8 102.02 G5
#TEAMS REGION Avg Rank Avg Pwr Top 10% Avg Rnk Top 10% Avg Pwr Bottom 10% Avg Rnk Bottom 10% Avg Pwr 31 North 100.6 104.74 48.3 114.93 157.5 95.13 34 South 116.2 101.94 48.7 114.85 188.5 90.31 FCS
#TEAMS REGION Avg Rank Avg Pwr Top 10% Avg Rnk Top 10% Avg Pwr Bottom 10% Avg Rnk Bottom 10% Avg Pwr 67 North 214.0 88.00 96.9 104.97 364.9 70.33 59 South 242.9 84.24 127.1 99.37 406.1 66.35 D2
#TEAMS REGION Avg Rank Avg Pwr Top 10% Avg Rnk Top 10% Avg Pwr Bottom 10% Avg Rnk Bottom 10% Avg Pwr 69 West 328.2 74.83 165.0 93.69 537.0 53.97 98 East 386.5 68.55 210.2 87.56 582.6 48.98 D3
#TEAMS REGION Avg Rank Avg Pwr Top 10% Avg Rnk Top 10% Avg Pwr Bottom 10% Avg Rnk Bottom 10% Avg Pwr 109 West 581.4 47.04 326.5 74.29 745.2 20.31 128* East 584.9 47.56 390.8 67.83 735.7 24.50 NAIA
#TEAMS REGION Avg Rank Avg Pwr Top 10% Avg Rnk Top 10% Avg Pwr Bottom 10% Avg Rnk Bottom 10% Avg Pwr 45 West 524.6 54.17 323.8 74.62 694.5 34.55 49 East 529.5 53.97 302.7 76.65 697.4 34.90 -
I've been attempting to mathematically show which areas of the country are best at football. As Floridians, we fundamentally believe the best college ball is played in the South. And obviously with the likes of Clemson, Alabama and LSU, it's very hard for others to dispute. But while attempting to validate this, I ran into a bit of a snag. As you can see above, the distribution of football playing colleges throughout the US is completely unbalanced. There are over 200 more colleges playing football east of the Mississippi River than there are to the west of it. If we dig into it further, there are "holes" found all over the map showing major imbalances depending on the level of football being discussed. For example, in New England, there are 58 colleges playing football but only one (Boston College) plays at the P5 level. In NY, NJ, Pennsylvania, Delaware there are another 96 football schools, 4 of which play P5 football. So out of the 154 colleges in the Northeastern US, only 5 play big time P5 football. This leaves 60 P5 schools for the rest of the country, 22 of which can be found in the traditional south. So I found the map to be geographically biased towards selected areas of the country. To compound matters, the more regions I used, the worse the situation became. So I decided to categorize each region and distribute the teams as fairly as possible trying to keep the number of teams and areas "balanced." The comparisons will be divided as follows:
P5 (North/South), G5 (North/South), FCS (North/South), D2 (East/West), D3 (East/West), NAIA (East/West).
To do this, I was required to completely disregard Conferences. So please keep that in mind because it will mess you up.
The data will be shown on my next post.
-
Here is a breakdown of all 768 (4 year) college football teams by state. I also created several maps that display a perfect visual of what I'm trying to show and discuss but unfortunately the files are a bit too large for me to post here. I'm pretty upset about it but maybe someone can educate me. It says I'm only allowed to post 81K. Help anyone?
STATE State Tot P5 G5 FCS D2 D3 NAIA N/A Pennsylvania 53 2 1 8 16 26 0 0 Texas 41 5 7 8 7 10 4 0 Ohio 41 1 7 2 9 21 1 0 North Carolina 33 4 3 7 13 5 1 0 Illinois 33 2 1 4 2 19 5 0 New York 31 1 2 9 1 18 0 0 Massachusetts 29 1 1 3 4 20 0 0 Virginia 26 2 2 6 3 10 1 2 Iowa 26 2 0 2 1 11 10 0 Minnesota 25 1 0 0 9 15 0 0 Michigan 24 2 3 0 9 7 3 0 Missouri 21 1 0 2 10 2 6 0 California 20 4 3 4 1 8 0 0 Florida 20 3 4 4 2 0 7 0 Indiana 20 3 1 3 1 8 4 0 Kansas 19 2 0 0 4 0 13 0 Tennessee 18 2 2 6 3 3 2 0 Georgia 18 2 2 2 8 2 2 0 Wisconsin 18 1 0 0 0 17 0 0 Kentucky 17 2 1 3 2 1 8 0 Alabama 16 2 3 5 3 2 1 0 South Carolina 14 2 1 6 4 0 1 0 Oklahoma 13 2 1 0 8 0 2 0 West Virginia 13 1 1 0 10 1 0 0 Louisiana 12 1 4 6 0 1 0 0 Arkansas 12 1 1 2 6 1 1 0 Oregon 11 2 0 1 1 5 2 0 Connecticut 10 0 1 3 2 4 0 0 Mississippi 10 2 1 3 2 2 0 0 Maryland 10 1 1 2 2 4 0 0 South Dakota 10 0 0 2 5 0 3 0 Colorado 10 1 2 1 6 0 0 0 Nebraska 10 1 0 0 3 1 5 0 New Jersey 9 1 0 2 0 6 0 0 North Dakota 9 0 0 2 2 0 4 1 Montana 7 0 0 2 0 0 5 0 Maine 7 0 0 1 0 6 0 0 Washington 7 2 0 1 1 3 0 0 Utah 6 1 2 2 1 0 0 0 Idaho 5 0 1 2 0 0 1 1 New Hampshire 5 0 0 2 2 1 0 0 Arizona 5 2 0 1 0 0 2 0 New Mexico 5 0 2 0 3 0 0 0 Rhode Island 4 0 0 3 0 1 0 0 District of Columbia 4 0 0 2 0 2 0 0 Delaware 3 0 0 2 0 1 0 0 Vermont 3 0 0 0 0 3 0 0 Nevada 2 0 2 0 0 0 0 0 Canada- BC 1 0 0 0 1 0 0 0 Hawaii 1 0 1 0 0 0 0 0 Wyoming 1 0 1 0 0 0 0 0 TOTAL 4 YR COLLEGE TEAMS 768 65 65 126 167 247 94 4 -
Here are some college FB numbers to chew on. This is my overall 5 Yr (2015-19) conference ranking for 4 year colleges. The member ranking represents the average final ranking of each conference's teams among all 768 teams. This is purely mathematical and unbiased. And yes, I have categorized P5 and G5 conferences separately for reasons to be revealed at a later date.
DIV CONFERENCE # Curr Members Curr Member Avg 5yr RANK Curr Member Avg 5yr PWR Top 2 Avg Final Rnk Top 2 Avg Pwr Bot 2 Avg Final Rnk Bot 2 Avg Pwr Std Dev Member Parity Conf Parity in Div P5 Independent 1 16.4 125.13 16.4 125.13 16.4 125.13 N/A N/A N/A P5 Southeastern 14 39.3 118.62 7.2 130.82 76.0 109.32 7.22 19 3 P5 Big 12 10 43.4 116.98 14.6 125.31 86.7 107.68 7.24 20 4 P5 Big 10 14 45.0 117.25 6.7 130.42 100.8 103.77 9.02 41 5 P5 Pacific 12 12 46.7 115.95 19.9 123.46 86.9 106.64 6.18 8 2 P5 Atlantic Coast 14 49.4 115.56 20.7 125.56 67.7 110.63 5.58 3 1 G5 American Athletic 12 80.1 108.60 46.4 115.32 141.5 97.38 6.39 11 4 G5 Mountain West 12 95.9 105.45 46.8 115.32 132.8 98.55 6.34 10 3 G5 Mid-American 12 110.8 102.76 66.7 110.80 147.5 96.47 5.45 2 1 G5 Sun Belt 10 120.5 101.06 69.1 110.28 171.8 92.52 7.06 16 5 G5 Conference USA 14 127.0 100.06 85.2 107.29 188.7 90.43 6.20 9 2 G5 Independent 5 128.9 99.96 73.4 109.38 170.7 93.08 9.95 47 6 FCS Missouri Valley 10 132.1 99.54 64.2 111.47 214.5 87.33 8.80 35 12 FCS Big Sky 14 164.9 94.04 113.0 101.89 224.7 85.87 5.14 1 1 FCS Colonial Athletic 12 167.5 93.52 105.1 103.35 216.5 87.02 5.89 7 4 FCS Southern 9 194.3 89.96 143.7 96.41 282.9 79.21 7.00 15 7 FCS Ivy League 8 201.5 89.38 146.3 97.20 267.7 80.58 6.97 14 6 FCS Ohio Valley 9 209.8 87.88 147.8 96.11 255.0 81.99 5.78 6 3 FCS Southland 11 216.0 87.32 139.6 96.90 296.6 77.84 7.13 18 8 FCS Big South 8 246.8 83.40 173.6 92.67 250.7 82.79 7.38 24 9 D2 Mid-America Intercoll. 12 253.1 83.65 131.1 98.97 487.7 59.04 14.53 74 16 FCS Patriot League 7 257.3 82.09 204.3 88.57 309.2 76.20 5.71 4 2 D2 Great Lakes Intercoll. 9 264.6 81.52 154.3 94.81 345.3 72.41 8.49 33 4 FCS Mid-Eastern Athletic 9 284.1 79.04 196.2 89.28 361.5 70.68 7.60 27 10 FCS Northeast 9 287.9 78.47 226.1 85.34 373.0 69.41 6.48 12 5 D2 Gulf South 9 294.8 78.00 215.7 86.82 429.7 64.04 11.76 61 12 D2 Lone Star 9 296.7 77.79 208.5 87.59 415.4 65.22 8.81 36 5 FCS Southwestern Athletic 10 316.7 75.64 209.2 87.42 437.9 63.24 9.42 45 13 D2 Great American 12 327.8 74.41 214.0 87.05 434.3 63.33 9.37 43 8 FCS Pioneer 10 331.8 74.03 219.2 86.37 401.6 66.92 7.84 28 11 D2 Pennsylvania State 16 346.0 72.59 222.6 85.83 503.6 57.30 9.48 46 9 D2 Great Lakes Valley 8 357.2 71.54 253.3 82.26 475.4 59.96 9.35 42 7 D2 Northern Sun Intercoll. 16 358.4 71.64 197.8 89.15 575.7 50.25 12.32 66 13 D2 South Atlantic 8 359.4 70.78 300.2 76.59 435.4 63.33 5.77 5 1 D2 Great Northwest Athl. 4 359.5 71.52 272.3 80.31 446.6 62.72 12.74 68 14 D2 Rocky Mountain 11 365.1 70.89 215.1 87.10 495.5 57.87 10.29 50 10 D2 Great Midwest Athl. 8 377.1 69.66 243.5 83.31 534.2 54.22 8.83 37 6 NAIA Frontier 8 407.6 66.04 336.8 72.98 526.6 54.45 8.76 34 3 D2 D-II Independent 1 421.2 65.02 421.2 65.02 421.2 65.02 N/A N/A N/A D2 Mountain East 12 423.9 64.80 312.9 75.69 510.9 56.96 6.56 13 2 D3 Wisconsin Intercoll. 8 440.8 63.15 311.9 75.76 565.6 51.48 9.97 48 11 D2 Northeast-10 9 447.6 61.96 303.6 76.66 611.8 44.85 12.93 69 15 D2 Southern Intercoll. 11 456.7 61.49 349.7 71.75 552.9 52.78 7.38 23 3 NAIA Mid-States 14 471.4 60.20 258.7 81.58 651.2 42.16 12.05 64 8 D2 Central Intercollegiate 12 484.8 58.52 338.7 72.69 637.7 43.33 10.80 53 11 D3 Conf.of Ill. and Wisc. 10 490.1 58.08 303.6 76.59 641.2 43.24 12.64 67 22 NAIA Great Plains Athl. 10 500.1 57.17 319.5 75.60 623.1 44.38 13.26 70 9 D3 Ohio Athletic 10 509.9 56.08 292.0 77.85 672.8 38.83 14.45 73 25 NAIA Mid-South 22 510.8 55.97 316.3 75.07 691.5 35.35 11.28 58 6 D3 Centennial 10 512.9 55.99 347.5 71.92 628.2 45.01 10.33 51 12 D3 American Southwest 10 515.1 55.60 285.7 78.78 662.2 41.01 14.42 72 24 D3 Empire Eight 7 520.6 55.10 440.8 62.75 611.1 45.72 8.01 31 7 D3 Minnesota Intercoll. 9 525.0 53.70 318.9 75.30 686.0 36.02 16.26 76 27 D3 Liberty League 7 534.0 53.52 450.0 61.84 637.3 42.39 8.85 38 8 NAIA Heart of America 12 537.7 52.79 372.4 69.56 682.8 36.07 8.99 40 4 D3 New Jersey Athl. 8 541.3 53.05 393.8 67.54 668.3 39.72 10.86 54 14 D3 Old Dominion Athl. 9 548.5 52.43 457.7 61.15 640.5 42.36 7.25 21 2 D3 Southern Athletic 9 558.7 51.40 454.2 61.61 653.9 41.74 7.84 29 5 D3 The Presidents' Athl. 10 562.4 50.53 428.1 64.05 676.3 37.51 10.80 52 13 D3 Northwest 8 567.8 49.71 413.2 65.23 689.6 35.31 11.92 62 19 D3 American Rivers 9 568.5 50.46 456.1 61.36 666.8 40.17 8.95 39 9 NAIA Sooner Athletic 9 585.7 47.43 446.2 62.36 689.8 34.86 11.32 59 7 NAIA North Star Athletic 6 591.2 47.57 494.5 58.07 683.6 36.61 10.27 49 5 D3 Middle Atlantic 11 595.0 46.61 431.1 64.01 714.6 29.73 12.24 65 21 D3 North Coast Athletic 10 595.9 46.68 468.8 60.21 698.0 34.26 11.01 56 16 D3 USA South 8 603.4 45.75 519.9 55.51 707.8 31.05 10.99 55 15 D3 Michigan Intercollegiate 8 608.1 43.93 531.8 54.47 720.1 24.64 14.11 71 23 NAIA Kansas Coll. Athl. 11 622.2 43.73 510.0 56.80 696.7 34.79 8.38 32 2 D3 So. California Intercoll. 8 625.3 43.03 522.8 55.31 727.5 27.19 11.05 57 17 D3 New England 8 635.8 42.81 538.9 54.13 709.9 32.35 9.42 44 10 D3 Commonwealth Coast 8 639.3 41.15 543.0 53.35 727.6 27.72 11.36 60 18 D3 Massachusetts SCA 9 642.6 41.85 562.8 51.39 697.0 35.60 7.10 17 1 D3 Heartland Coll. Athletic 8 644.2 40.81 562.0 51.25 731.6 26.98 12.00 63 20 NAIA NAIA Independent 2 669.8 39.26 669.8 39.26 669.8 39.26 7.39 25 1 D3 Midwest 12 670.6 34.57 520.3 55.51 754.0 14.44 15.08 75 26 D3 Northern Athletics 8 682.2 36.17 627.9 44.44 731.5 27.35 7.28 22 3 N/A Non-Affiliated 4 721.8 21.09 679.9 37.31 763.6 4.86 19.06 77 1 D3 Upper Midwest Athl. 9 727.9 24.00 694.5 33.12 754.1 14.39 7.50 26 4 D3 Eastern Collegiate 6 727.9 26.04 696.4 34.40 752.5 18.91 7.90 30 6 DIV Disconnected Conf # Curr Members Curr Member Avg 5yr RANK Curr Member Avg 5yr PWR Top 2 Avg Final Rnk Top 2 Avg Pwr Bot 2 Avg Final Rnk Bot 2 Avg Pwr Std Dev Member Parity Conf Parity in Div D3 New England Small 10 N/A 60.99 N/A 72.60 N/A 48.82 9.53 1 N/A -
I've updated Florida's Best on my website.
http://lazindex.com/floridasbest.php
http://lazindex.com/floridasbest.php?geopower
- DisabledAccount and 954gator
-
 1
1
-
 1
1
-
17 hours ago, gatorman-uf said:
No real surprises honestly, it looks like it is spread out among numerous classifications and regions of Florida.
I wonder what state title team since 2000 has the worst winning percentage over the same period as above. My guess would Nease or Jupiter Christian or Jefferson County.
Actually it is Jefferson County who comes in at 0.387. Followed by FAMU (0.435), Flanagan (0.493) and then Nease (0.519).
Jupiter Christian is actually 0.602 over the past twenty seasons.
- DarterBlue2 and gatorman-uf
-
2
-
Here are the best programs to have not reached a state title game this century, sorted by their W-L Pct. vs. Florida Competition (2000-2019). Out of State contests are not included.
School W L Pct Vero Beach 168 51 0.767 Jesuit (Tampa) 178 58 0.754 Hillsborough (Tampa) 160 63 0.717 Columbia (Lake City) 164 65 0.716 Fletcher (Neptune Beach) 159 66 0.707 Largo 159 66 0.707 Fort Myers 161 67 0.706 Charlotte (Punta Gorda) 161 69 0.700 Lafayette (Mayo) 151 66 0.696 Countryside (Clearwater) 149 66 0.693 Hardee (Wauchula) 153 68 0.692 Dunnellon 147 68 0.684 Dixie County (Cross City) 150 70 0.682 First Baptist (Naples) 77 36 0.681 First Academy (Orlando) 151 71 0.680 South Fort Myers 112 56 0.667 Park Vista (Lake Worth) 109 55 0.665 Calvary Christian (Fort Lauderdale) 104 53 0.662 Merritt Island 149 77 0.659 Lake Wales 147 77 0.656 Winter Park 145 78 0.650 Fleming Island (Orange Park) 120 65 0.649 Winter Haven 143 78 0.647 Plantation 140 77 0.645 Pace 139 78 0.641 -
On the flip side, here are the worst winning percentages by division from 2000-2019. Same rules apply. NCAA D1 FBS (P5) CONF W L Pct Kansas BIG12 78 162 0.325 Duke ACC 82 161 0.337 Vanderbilt SEC 87 155 0.360 Indiana BIG10 88 152 0.367 Illinois BIG10 91 151 0.376 Colorado PAC12 102 147 0.410 Iowa St BIG12 106 142 0.427 Syracuse ACC 104 139 0.428 Kentucky SEC 107 138 0.437 Rutgers BIG10 107 138 0.437 NCAA D1 FBS (G5) CONF W L Pct New Mexico St IND 66 176 0.273 Eastern Michigan MAC 67 172 0.280 UNLV MWC 76 166 0.314 Army IND 80 162 0.331 UTEP CUSA 82 160 0.339 Buffalo MAC 83 158 0.344 Kent St MAC 83 155 0.349 Tulane AAC 86 156 0.355 Louisiana-Monroe SBC 85 153 0.357 Akron MAC 88 153 0.365 NCAA D1 FCS CONF W L Pct VMI SoC 49 176 0.218 Mississippi Valley St SWAC 49 169 0.225 Valparaiso (IN) PL 60 162 0.270 Rhode Island CAA 63 163 0.279 Columbia (NY) IVY 56 144 0.280 Idaho BSC 68 170 0.286 Moved down from FBS to FCS 2018 St Francis (PA) NEC 63 154 0.290 Indiana St MVFC 67 161 0.294 Austin Peay (TN) OVC 68 159 0.300 Texas Southern SWAC 67 153 0.305 NCAA D2 CONF W L Pct Minnesota-Crookston NSC 29 188 0.134 Savannah St (GA) SIAC 37 176 0.174 moved from D2 to FCS in 2001; moved back to D2 2019 Lock Haven (PA) PSAC 39 179 0.179 Lincoln (MO) MIAA 38 169 0.184 Livingstone (NC) CIAA 40 158 0.202 Moved up from NAIA to D2 in 2002. Pace (NY) NE-10 44 158 0.218 Kentucky Wesleyan GMAC 48 160 0.231 Moved down D2 to NAIA 2004; back up to D2 in 2006 New Mexico Highlands RMC 53 163 0.245 St Anselm (NH) NE-10 51 154 0.249 Clark Atlanta (GA) SIAC 50 150 0.250 NCAA D3 CONF W L Pct Hiram (OH) NCAC 31 169 0.155 Iowa Wesleyan UMAC 38 169 0.184 Moved from NAIA to D3 in 2013 North Park (IL) CCIW 37 163 0.185 Wilmington (OH) OAC 40 160 0.200 Whittier (CA) SCIAC 37 144 0.204 Lawrence (WI) Midwest 42 156 0.212 Hamilton (NY) NESCAC 35 128 0.215 Kenyon (OH) NCAC 44 156 0.220 Lewis & Clark (OR) NWC 40 135 0.229 FDU-Florham (NJ) NJAC 46 154 0.230 NAIA CONF W L Pct Culver-Stockton (MO) HAAC 48 168 0.222 Mayville St (ND) NSAA 46 157 0.227 Montana St-Northern FC 57 153 0.271 SW Assemblies of God (TX) SAC 62 138 0.310 Central Methodist (MO) HAAC 68 145 0.319 Dakota St (SD) NSAA 66 138 0.324 Union (KY) MSC 69 141 0.329 Trinity International (IL) MSFA 71 144 0.330 Panhandle St (OK) SAC 70 139 0.335 Moved from D2 to NAIA in 2017 St Mary (KS) KCAC 69 134 0.340 -
Best Winning Pct. over the past 20 seasons by Current Division. In order to qualify, team must have been active in 2000 and still competing in 2019. NCAA D1 FBS (P5) CONF W L Pct Ohio St BIG10 219 43 0.836 BCS Champs 2002; FBS Champs 2014 Oklahoma BIG12 219 49 0.817 BCS Champs 2000 LSU SEC 202 59 0.774 BCS Champs 2003, 2007; FBS Champs 2019 Alabama SEC 203 63 0.763 BCS Champs 2009, 2011, 2012; FBS Champs 2015, 2017 Georgia SEC 198 67 0.747 Clemson ACC 196 70 0.737 FBS Champs 2016, 2018 Oregon PAC12 188 70 0.729 Southern California PAC12 188 71 0.726 BCS Champs 2004 TCU BIG12 182 71 0.719 Moved up from G5 to P5 2012 Wisconsin BIG10 188 77 0.709 NCAA D1 FBS (G5) CONF W L Pct Boise St MWC 219 43 0.836 Appalachian St SBC 192 69 0.736 FCS Champs 2005, 2006, 2007; moved from FCS to G5 in 2014 Georgia Southern SBC 161 90 0.641 FCS Champs 2000; moved up from FCS to G5 in 2014 Toledo MAC 158 92 0.632 Northern Illinois MAC 159 97 0.621 Brigham Young IND 158 97 0.620 Cincinnati AAC 157 97 0.618 UCF AAC 145 106 0.578 Marshall CUSA 145 107 0.575 Fresno St MWC 149 111 0.573 NCAA D1 FCS CONF W L Pct North Dakota St MVFC 210 51 0.805 Moved from D2 to FCS 2004 - FCS Champs 2011-2015,2017-2019 Harvard IVY 150 49 0.754 Montana BSC 198 67 0.747 FCS Champ 2001 Dayton PL 162 59 0.733 San Diego PL 160 63 0.717 North Alabama BSo 162 73 0.689 Moved from D2 to FCS 2018 James Madison CAA 170 82 0.675 FCS Champs 2004, 2016 McNeese St SLC 155 76 0.671 Bethune-Cookman MEAC 151 75 0.668 Jacksonville St (AL) OVC 157 78 0.668 NCAA D2 CONF W L Pct NW Missouri St MIAA 232 39 0.856 D2 Champs 2009, 2013, 2015, 2016 Grand Valley St (MI) GLIAC 217 41 0.841 D2 Champs 2002, 2003, 2005, 2006 Sioux Falls (SD) NSC 209 40 0.839 NAIA Champs 2006, 2008, 2009 -Moved from NAIA to D2 2011 Valdosta St (GA) GSC 192 47 0.803 D2 Champs 2004, 2007, 2012, 2018 Shepherd (WV) PSAC 177 49 0.783 Tuskegee (AL) SIAC 177 51 0.776 Minnesota-Duluth NSC 189 55 0.775 D2 Champions 2008, 2010 Indiana (PA) PSAC 169 57 0.748 Bloomsburg (PA) PSAC 173 60 0.742 Pittsburg St (KS) MIAA 177 64 0.734 D2 Champion 2011 NCAA D3 CONF W L Pct Mount Union (OH) OAC 277 13 0.955 D3 Champs 2000, 2001, 2002, 2005, 2006, 2008, 2012, 2015, 2017 Mary Hardin-Baylor (TX) ASC 230 27 0.895 D3 Champs 2016, 2018 Linfield (OR) NWC 187 32 0.854 D3 Champs 2004 UW-Whitewater (WI) WIAC 222 38 0.854 D3 Champs 2007, 2009, 2010, 2011, 2013, 2014 Trinity (CT) NESCAC 135 28 0.828 Wheaton (IL) CCIW 184 41 0.818 Wash & Jeff (PA) PAC 185 42 0.815 Wabash (IN) NCAC 179 41 0.814 St John's (MN) MIAC 195 45 0.813 D3 Champs 2003 Wesley (DE) NJAC 193 47 0.804 NAIA CONF W L Pct St Francis (IN) MSFA 209 39 0.843 NAIA Champs 2016, 2017 Carroll (MT) FC 202 53 0.792 NAIA Champs 2002, 2003, 2004, 2005, 2007, 2010 Morningside (IA) GPAC 185 50 0.787 NAIA Champs 2018, 2019 Georgetown (KY) MSC 176 54 0.765 NAIA Champs 2000, 2001 St Xavier (IN) MSFA 180 63 0.741 NAIA Champs 2011 Northwestern (IA) GPAC 158 60 0.725 MidAmerica Nazarene (KS) HAAC 165 63 0.724 Thomas More (KY) MSC 152 60 0.717 Moved from D3 to NAIA 2019 Benedictine (KS) HAAC 158 73 0.684 Cumberlands (KY) MSC 143 74 0.659 -
On the flip side, here are the worst winning percentages by division from 2015-2019. Same rules apply. These teams need some help.
NCAA D1 FBS (P5) CONF W L Pct Kansas BIG12 9 51 0.150 Rutgers BIG10 13 47 0.217 Oregon St PAC12 14 46 0.233 Illinois BIG10 20 41 0.328 Maryland BIG10 21 40 0.344 Purdue BIG10 22 40 0.355 Arkansas SEC 23 39 0.371 Vanderbilt SEC 24 38 0.387 UCLA PAC12 25 37 0.403 Arizona PAC12 26 36 0.419 NCAA D1 FBS (G5) CONF W L Pct UTEP CUSA 11 49 0.183 Texas St SBC 13 47 0.217 Rice CUSA 14 47 0.230 Massachusetts IND 14 46 0.233 Connecticut AAC 15 46 0.246 Kent St MAC 17 44 0.279 San Jose St MWC 18 44 0.290 New Mexico St IND 18 43 0.295 East Carolina AAC 18 42 0.300 Ball St MAC 18 42 0.300 NCAA D1 FCS CONF W L Pct Mississippi Valley St SWAC 7 48 0.127 Delaware St MEAC 8 48 0.143 VMI SoC 11 45 0.196 Texas Southern SWAC 11 43 0.204 Houston Baptist SLC 12 43 0.218 Presbyterian BSo 12 42 0.222 Lafayette PFL 13 43 0.232 Missouri St MVFC 13 42 0.236 Ark-Pine Bluff SWAC 13 42 0.236 Rhode Island CAA 14 42 0.250 NCAA D2 CONF W L Pct Minnesota-Crookston NSC 2 53 0.036 Simon Fraser (BC) GNAC 2 47 0.041 Shorter (GA) GSC 3 51 0.056 Lincoln (PA) CIAA 5 45 0.100 Missouri Southern MIAA 6 49 0.109 Northeastern St (OK) MIAA 6 49 0.109 Mary (ND) NSC 6 49 0.109 Lake Erie (OH) GMAC 7 47 0.130 Lincoln (MO) MIAA 7 47 0.130 William Jewell (MO) GLVC 9 44 0.170 NCAA D3 CONF W L Pct Whittier (CA) SCIAC 4 41 0.089 Maine Maritime NEWMAC 5 41 0.109 Grinnell (IA) Midwest 5 38 0.116 Finlandia (MI) MIAA 5 37 0.119 William Paterson (NJ) NJAC 6 44 0.120 Anna Maria (MA) ECC 6 44 0.120 Thiel (PA) PAC 7 43 0.140 Wilmington (OH) OAC 7 43 0.140 Greensboro (NC) USAS 7 43 0.140 Iowa Wesleyan UMAC 7 43 0.140 NAIA CONF W L Pct Montana St-Northern FC 4 50 0.074 Texas College SAC 5 42 0.106 Edward Waters (FL) IND 9 40 0.184 Trinity International (IL) MSFA 10 43 0.189 Kentucky Christian MSC 11 44 0.200 Graceland (IA) HAAC 11 44 0.200 Culver-Stockton (MO) HAAC 12 43 0.218 Missouri Baptist MSFA 12 42 0.222 McPherson (KS) KCAC 12 40 0.231 Union (KY) MSC 13 39 0.250 -
Best Winning Pct. over the past 5 seasons by Division. In order to qualify, team must have participated in their Division from 2015 through 2019.
NCAA D1 FBS (P5) CONF W L Pct Clemson ACC 69 5 0.932 FBS Champions 2016, 2018 Alabama SEC 66 6 0.917 FBS Champion 2015, 2017 Ohio St BIG10 61 7 0.897 Oklahoma BIG12 58 10 0.853 LSU SEC 51 14 0.785 FBS Champions 2019 Georgia SEC 54 15 0.783 Wisconsin BIG10 52 16 0.765 Penn St BIG10 49 17 0.742 Notre Dame IND 47 17 0.734 Michigan BIG10 47 18 0.723 NCAA D1 FBS (G5) CONF W L Pct Appalachian St SBC 54 12 0.818 Boise St MWC 52 15 0.776 San Diego St MWC 49 18 0.731 Memphis AAC 47 20 0.701 Toledo MAC 43 21 0.672 Louisiana Tech CUSA 43 23 0.652 Temple AAC 43 24 0.642 UCF AAC 41 23 0.641 Houston AAC 41 23 0.641 South Florida AAC 40 23 0.635 Troy SBC 40 23 0.635 NCAA D1 FCS CONF W L Pct North Dakota St MVFC 70 5 0.933 FCS Champion 2015, 2017, 2018, 2019 James Madison CAA 60 11 0.845 FCS Champion 2016 North Carolina A&T MEAC 50 10 0.833 San Diego U. PL 47 13 0.783 Dartmouth IVY 39 11 0.780 Kennesaw St BSo 48 15 0.762 new program 2015 Jacksonville St (AL) OVC 48 16 0.750 Sam Houston St SLC 48 17 0.738 Grambling St SWAC 44 16 0.733 Princeton IVY 36 14 0.720 NCAA D2 CONF W L Pct NW Missouri St MIAA 61 8 0.884 D2 Champions 2015, 2016 Ferris St (MI) GLIAC 61 8 0.884 Mankato St (MN) NSC 58 8 0.879 Shepherd (WV) PSAC 53 9 0.855 Indiana (PA) PSAC 50 11 0.820 Colorado St-Pueblo RMAC 51 12 0.810 Valdosta St (GA) GSC 46 11 0.807 D2 Champions 2018 Grand Valley St (MI) GLIAC 50 12 0.806 Slippery Rock (PA) PSAC 51 13 0.797 Minnesota-Duluth NSC 47 12 0.797 NCAA D3 CONF W L Pct Mount Union (OH) OAC 67 4 0.944 D3 Champions 2015, 2017 Mary Hardin-Baylor (TX) ASC 67 4 0.944 D3 Champions 2016, 2018 St Thomas (MN) MIAC 53 8 0.869 Wheaton (IL) CCIW 50 8 0.862 UW-Whitewater (WI) WIAC 56 9 0.862 St John's (MN) MIAC 53 9 0.855 North Central (IL) CCIW 52 9 0.852 D3 Champions 2019 Johns Hopkins (MD) CC 51 9 0.850 Delaware Valley (PA) MAC 50 9 0.847 Berry (GA) SAA 46 9 0.836 NAIA CONF W L Pct Morningside (IA) GPAC 64 5 0.928 NAIA Champion 2018, 2019 St Francis (IN) MSFA 55 8 0.873 NAIA Champions 2016, 2017 Marian (IN) MSFA 52 8 0.867 NAIA Champion 2015 Kansas Wesleyan KCAC 52 9 0.852 Reinhardt (GA) MSC 51 9 0.850 Lindsey Wilson (KY) MSC 49 10 0.831 Baker (KS) HAAC 53 11 0.828 Grand View (IA) HAAC 50 12 0.806 Langston (OK) SAC 40 10 0.800 Southeastern U. (FL) MSC 37 11 0.771 -
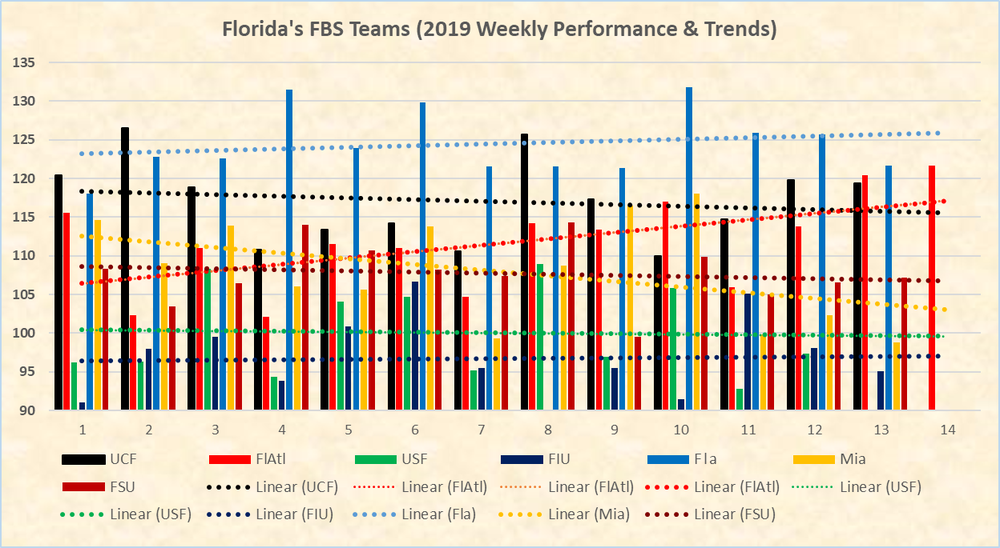
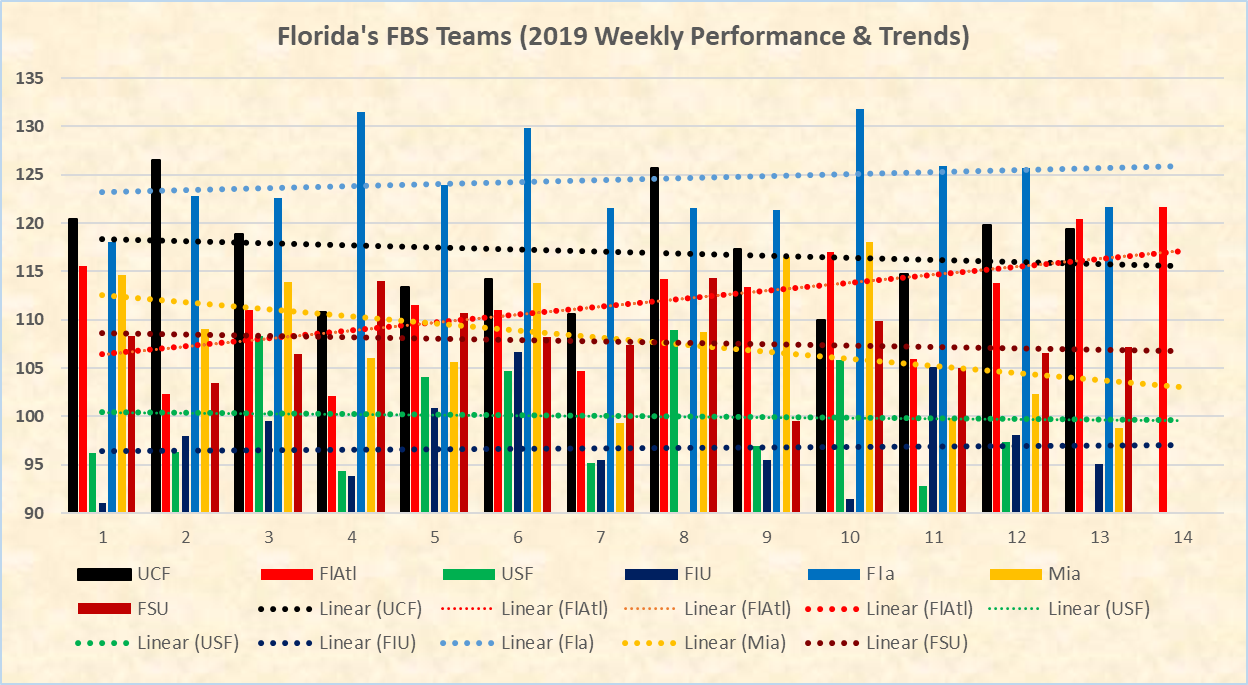
Here is a chart showing the 2019 weekly power rating performance of our state's FBS teams. What's interesting to note are the trend lines. While schools like Florida, USF and FIU remained static throughout the season, the others display "cross-over" points. For example, the data shows that even though UCF blew out FAU at the beginning of the year, if they were to play again at the end of the season, the game should be much, much closer with FAU possibly winning. The same is true for Miami and FSU. The reverse happens with Florida and Miami. It shows that despite their first game being close, if the Gators and 'Canes played again at year's end, the Gators would have probably hammered them.
- DisabledAccount and Perspective
-
1
-
1
-
20 hours ago, peezy28 said:
Laz are you using Tableau?
Hey Peezy! Nah, just plain ol' Excel. I'm in the Geritol club, remember? I can't keep up with all you whippersnappers and your new technology. LOL
Actually, I have heard of it but I've never even seen it in action, let alone use it.
Happy New Year! You were missed at the state championships.
-
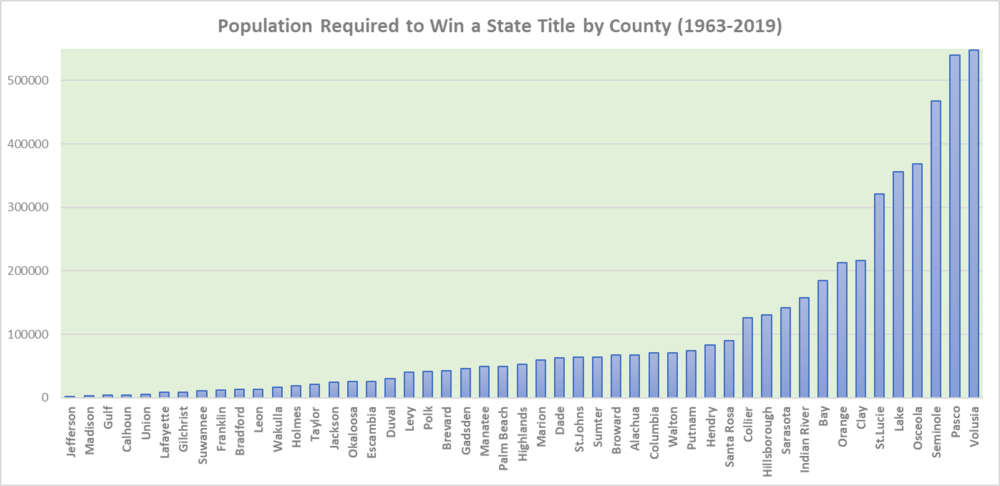
15 hours ago, Pipe Dreams said:
do a per capita titles per year field!
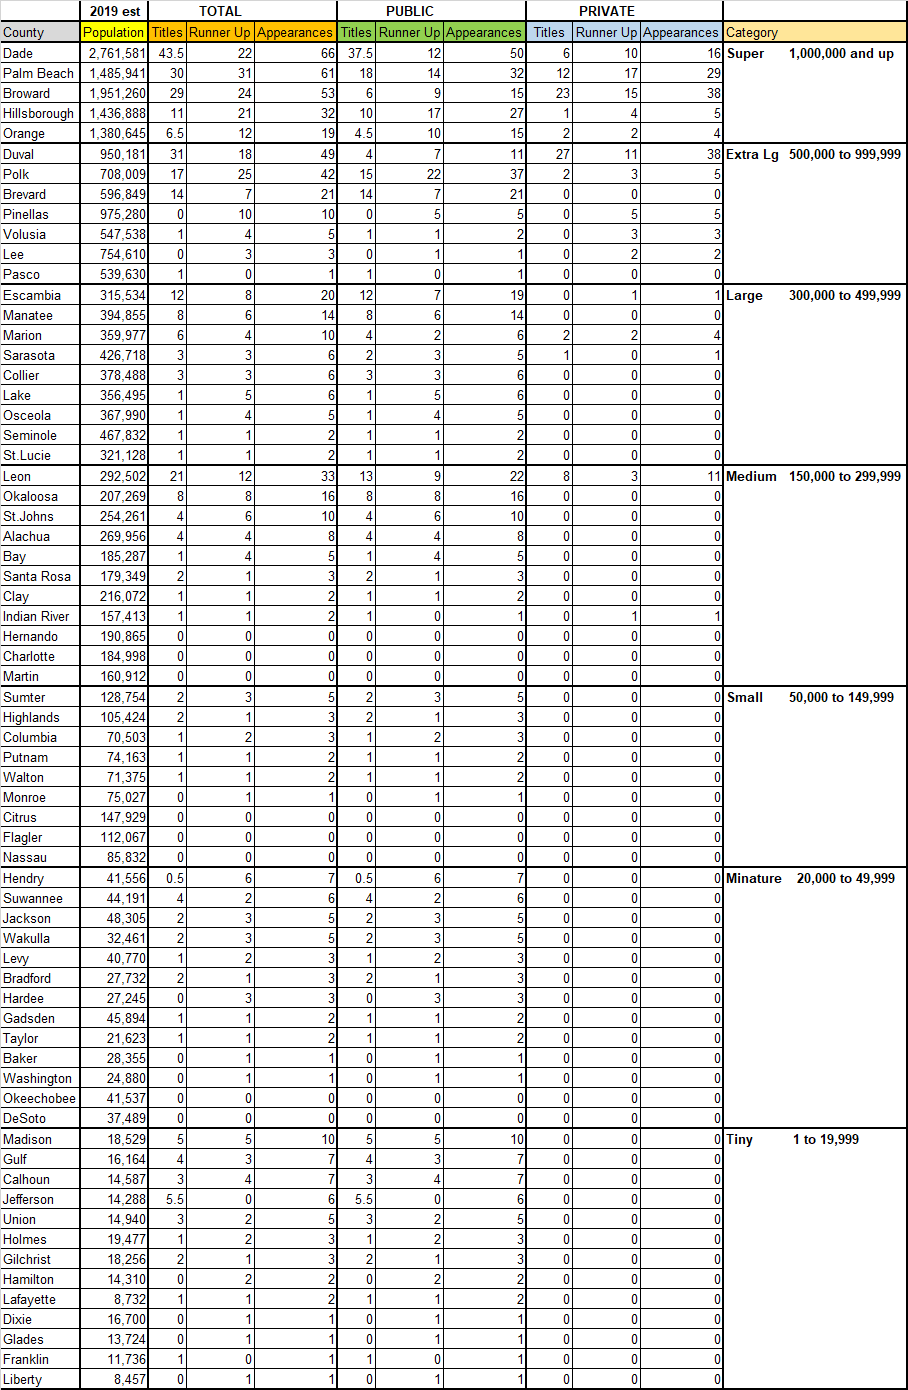
To properly do so, one would have to assume the county populations were constant over the past 57 years. I don't believe they were but using the current census, here's a chart showing the population required by county to win a title. I believe it's similar to what you're looking for.
-
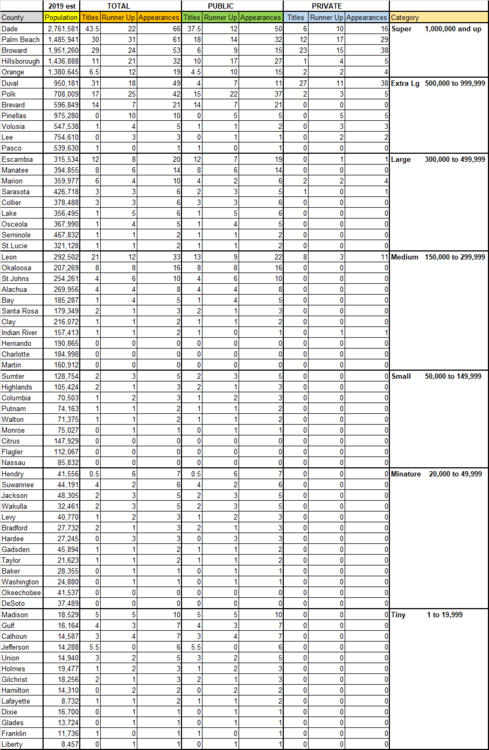
I'll be going into greater detail on my site in a couple of weeks. But here is the championship data from 1963-2019 by County Size and by title appearances Public and Private.
- peezy28 and Perspective
-
2
-
Perhaps this is another way to get my message across. I've charted the MEDIAN final state rankings for teams in each classification over the past 5 seasons. This reflects the data along with a linear line which one would expect to see when we have 8 different classifications, assuming the reason for having so many is based on the theory that the more populated schools have an advantage over the less populated. The classifications to the left of the linear line are "over-performing and the classes to the right are under-performing.

-
1 hour ago, HuffyLegend said:
1A schools are usually much larger than 2A, and even 3A schools. Why they chose the #'s (1A, 2A, 3A, etc.) the way they did is so perfectly "FHSAA." (a synonym for careless). So by the #'s, they should be a TD above. That's similar to saying 4A schools are a TD favorite over 3A schools. Would you agree?
Class 3A: 749 - 377; Class 2A: 376 - 56; Class 1A (rural): 600 – 100
Not necessarily a touchdown but it would seem logical to me that the only reason we would have eight classes based on size, is because the higher classes have a significant advantage in the level of performance due to their student population. Clearly, this is not the case. So this reasoning does not compute. Based on actual on-field performance, we are splitting hairs here. Especially with classes 6A through 8A. What is the real reason for having eight state champions? The data says there is no need for more than 5 or 6 at the very most. I'm just of the opinion that we need a complete overhaul of the current classification system. The options are out there, we either haven't found them or we have and won't implement amidst fear of change. Personally, my biggest fear is if a restructure were to occur, history will repeat itself and we will actually end up increasing the number of classifications. Quite possibly, I would find this ridiculous and would more than likely lose interest all together. In my perfect world, there would be no more than 4 classifications. Large Public, Large Private, Small Public, Small Private. Each would win a State Title. Four Champions, not eight.
-
Actually only slightly. A lot less than most people would imagine. It's not even worth charting. If we remove Madison County from 1A, the 5 year number drops from 110.11 to 109.69. And while Madison County is surely the most dominant team in 1A, the balance of the class is steady. Unlike 2A where the bottom half of the class is more on par with large school Freshman or JV teams. That's not a slight to Champagnat, University Chr, Victory Chr and some others who obviously have some pretty good programs, so please I mean no harm by that comment. But the fact still remains. The average 1A team (with or without Madison County) is still at least a touchdown better than the average 2A team.
-
Done a lot of analysis on this one as well over the past 17 years. I'm absolutely positive if Pinkos, Massey, etc. were to perform the same exercise, their charts would look very similar.
Class 5 Yr Avg 8A 127.80 6A 126.86 7A 126.77 5A 122.96 3A 122.30 4A 114.58 1A 110.11 2A 101.82 
-
Over the past five seasons, 5003 inter-classification games were played in Florida. This does not include 907 games played vs. Florida Independents or any out of state opponents during that time. The results are shown below and the data has been consistent since I began researching this is 2003. The Larger Classed Schools win 52% of the time and the Smaller Classed Schools win 48%. It keeps begging the same question I've asked for years. If Bigger is not necessarily better, why have so many classes? Here are the totals from 2015-2019:
Matchup W L Pct 8A vs 7A 334 283 0.541 8A vs 6A 167 119 0.584 8A vs 5A 101 95 0.515 8A vs 4A 49 67 0.422 8A vs 3A 13 36 0.265 8A vs 2A 3 0 1.000 8A vs 1A 5 10 0.333 7A vs 8A 283 334 0.459 7A vs 6A 296 258 0.534 7A vs 5A 285 182 0.610 7A vs 4A 53 58 0.477 7A vs 3A 25 35 0.417 7A vs 2A 4 5 0.444 7A vs 1A 9 7 0.563 6A vs 8A 119 167 0.416 6A vs 7A 258 296 0.466 6A vs 5A 373 273 0.577 6A vs 4A 88 72 0.550 6A vs 3A 48 44 0.522 6A vs 2A 16 8 0.667 6A vs 1A 9 6 0.600 5A vs 8A 95 101 0.485 5A vs 7A 182 285 0.390 5A vs 6A 273 373 0.423 5A vs 4A 140 125 0.528 5A vs 3A 62 93 0.400 5A vs 2A 25 7 0.781 5A vs 1A 33 37 0.471 4A vs 8A 67 49 0.578 4A vs 7A 58 53 0.523 4A vs 6A 72 88 0.450 4A vs 5A 125 140 0.472 4A vs 3A 114 161 0.415 4A vs 2A 59 61 0.492 4A vs 1A 90 132 0.405 3A vs 8A 36 13 0.735 3A vs 7A 35 25 0.583 3A vs 6A 44 48 0.478 3A vs 5A 93 62 0.600 3A vs 4A 161 114 0.585 3A vs 2A 123 74 0.624 3A vs 1A 54 50 0.519 2A vs 8A 0 3 0.000 2A vs 7A 5 4 0.556 2A vs 6A 8 16 0.333 2A vs 5A 7 25 0.219 2A vs 4A 61 59 0.508 2A vs 3A 74 123 0.376 2A vs 1A 46 81 0.362 1A vs 8A 10 5 0.667 1A vs 7A 7 9 0.438 1A vs 6A 6 9 0.400 1A vs 5A 37 33 0.529 1A vs 4A 132 90 0.595 1A vs 3A 50 54 0.481 1A vs 2A 81 46 0.638 Larger 2624 2379 0.524 Smaller 2379 2624 0.476


Potential Playoff Upsets?
in The Huddle
Posted
I know this area very well. Hobart is located in Geneva which is between Rochester and Syracuse. You’ll be better off flying to one of those cities instead of Buffalo, at least from a distance standpoint. Hobart usually has a pretty decent D3 team and there are always possibilities. Just ask Ali Marpet (Not sure of spelling), a D3 all-American OL who’s currently injured but starts for Tampa Bay.
Geneva sits on the north end of Seneca Lake which is the biggest of the Finger Lakes. And oh yeah, I’d be remiss if I didn’t mention the several dozen wineries in the area for your pre and post game enjoyment.